Chart
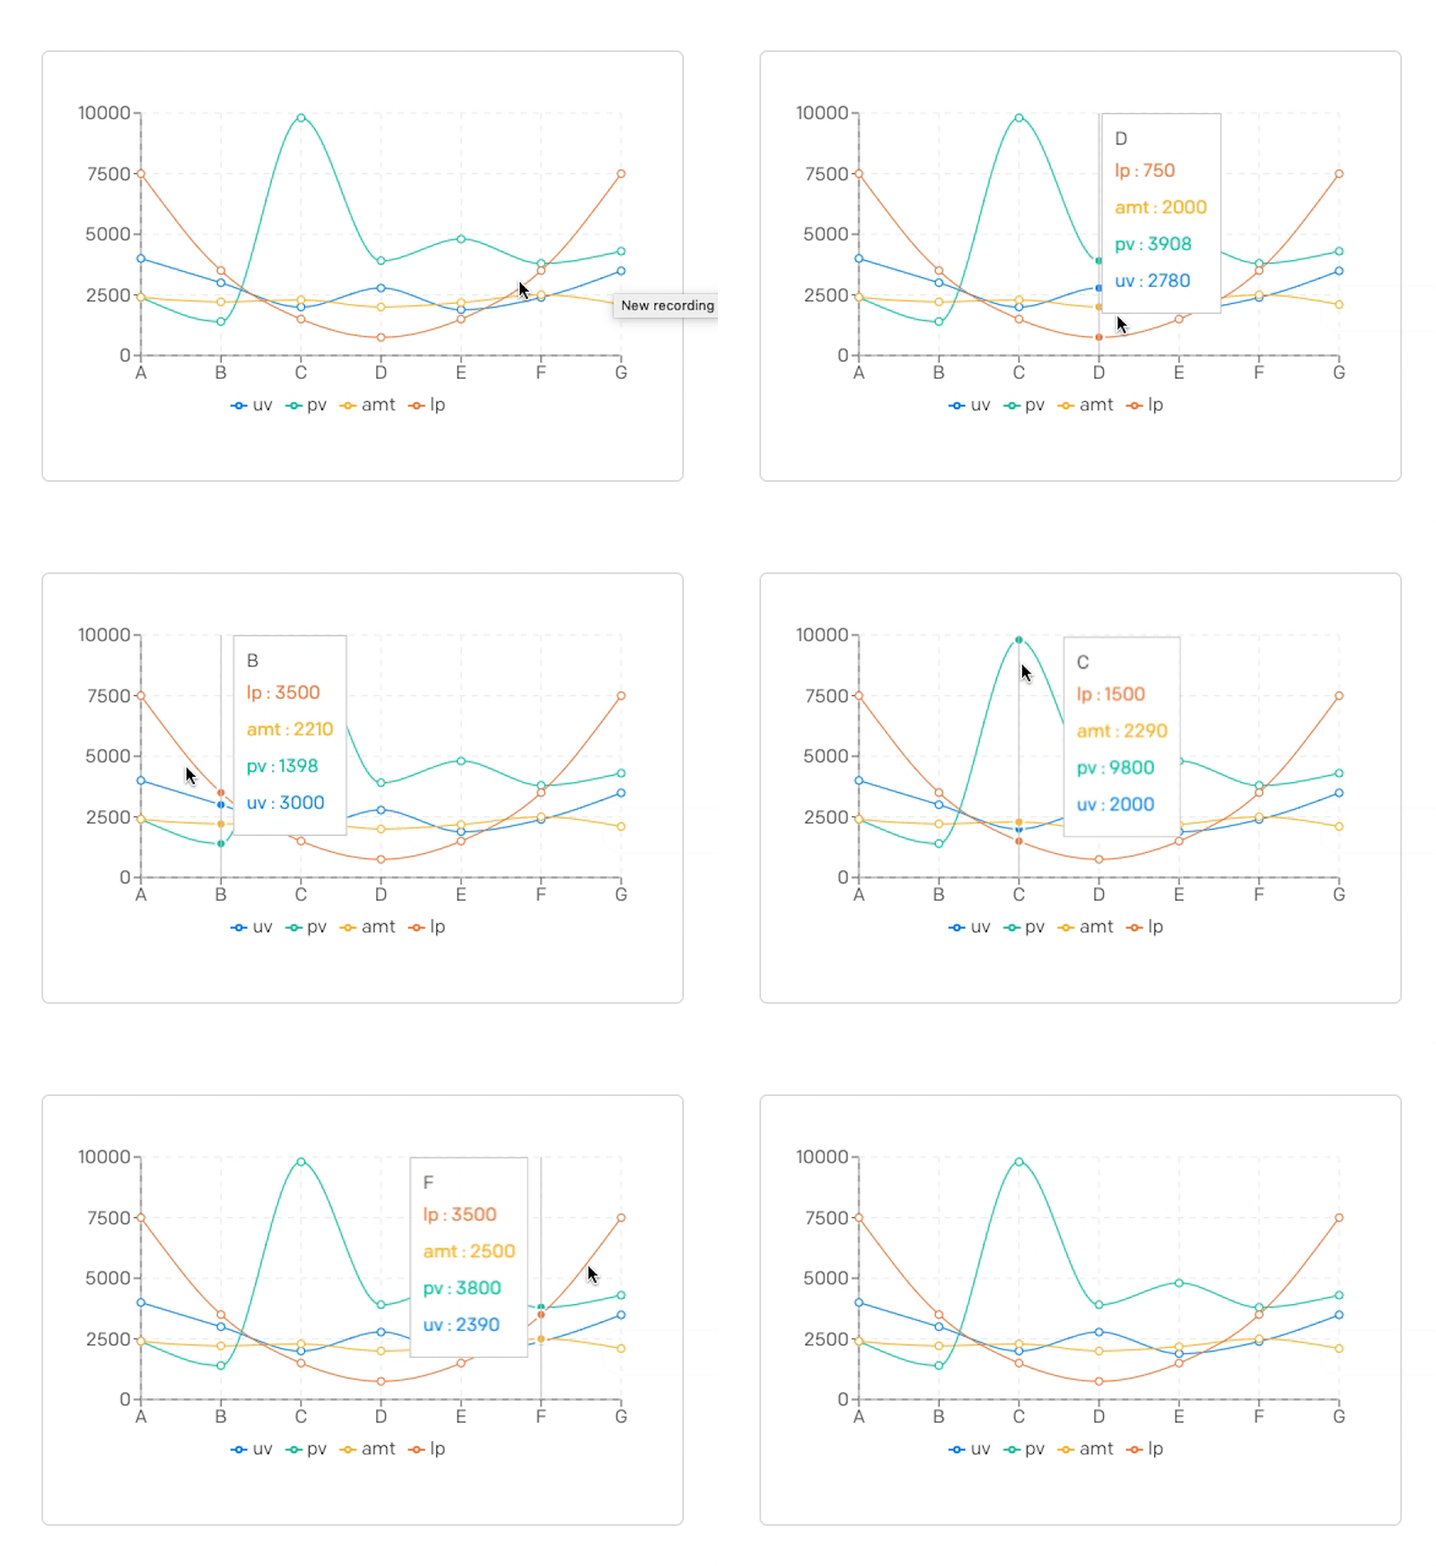
Chart from a json field

Chart DatoCMS plugin
Chart from a json field
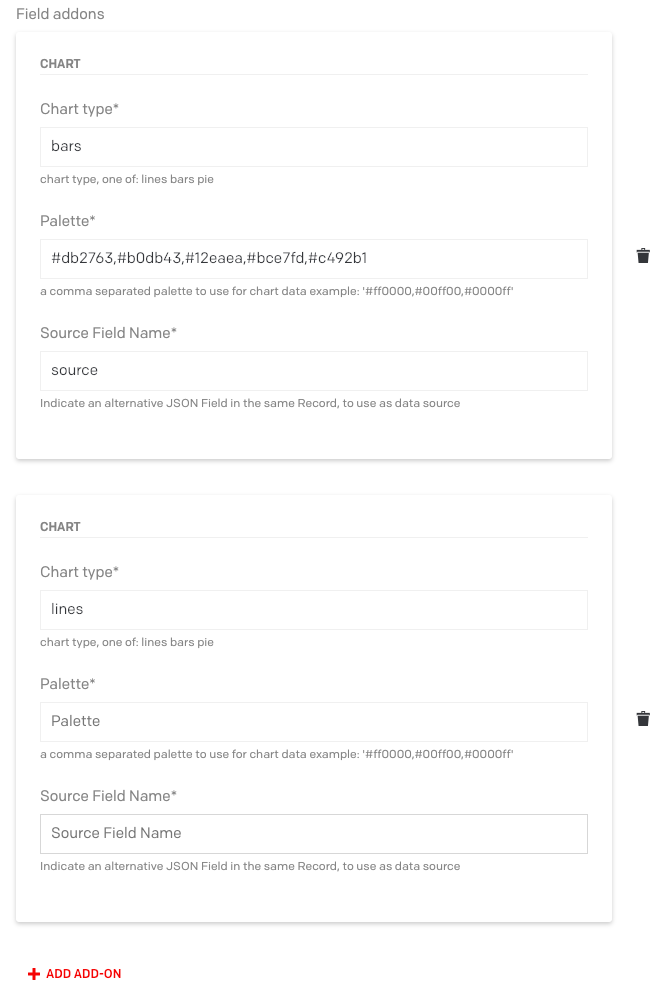
Configuration
A chart plugin made with recharts. Works only with JSON Fields

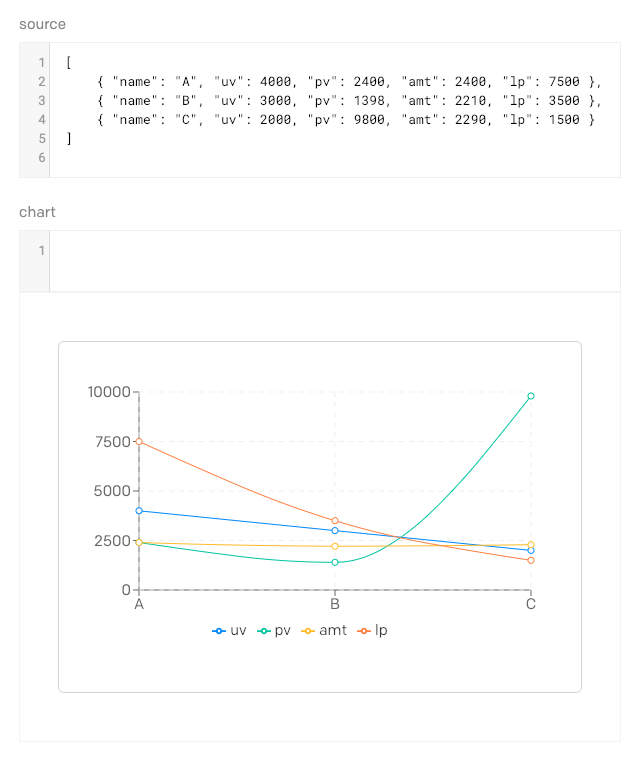
This is the source data for the example image. The Data must have an attribute "name" to identify the X axis elements and the other keys are data items related to named points.
[ { "name": "A", "uv": 4000, "pv": 2400, "amt": 2400, "lp": 7500 }, { "name": "B", "uv": 3000, "pv": 1398, "amt": 2210, "lp": 3500 }, { "name": "C", "uv": 2000, "pv": 9800, "amt": 2290, "lp": 1500 }, { "name": "D", "uv": 2780, "pv": 3908, "amt": 2000, "lp": 750 }, { "name": "E", "uv": 1890, "pv": 4800, "amt": 2181, "lp": 1500 }, { "name": "F", "uv": 2390, "pv": 3800, "amt": 2500, "lp": 3500 }, { "name": "G", "uv": 3490, "pv": 4300, "amt": 2100, "lp": 7500 }]This plugin is an addon so you could create more chart instance on the same field, to change source data, you can specify another json field. The alternative source field must belong to the same record.

in this example we are using a previous json field named "source" as datasource for he chart.

You can personalize lines bars and pies colors passing a string containing a comma separated color list per intance.
for example: '#0088FE,#00C49F,#FFBB28,#FF8042'
Example of Bars Chart

Expample of Pie Chart
[ { "name": "Group A", "value": 400 }, { "name": "Group B", "value": 300 }, { "name": "Group C", "value": 300 }, { "name": "Group D", "value": 200 }, { "name": "Group E", "value": 278 }, { "name": "Group F", "value": 189 }]
Development
Install all the project dependencies with:
yarn installAdd this plugin in development mode to one of your DatoCMS project with:
yarn addToProjectStart the local development server with:
yarn startThe plugin will be served from <https://datocms-plugin-chart.localtunnel.me/>. Insert this URL as the plugin Entry point URL.
Publishing
Before publishing this plugin, make sure:
- you've properly described any configuration parameters in this README file;
- you've properly compiled this project's
package.jsonfollowing the official rules; - you've added a cover image (
cover.png) and a preview GIF (preview.gif) into thedocsfolder.
When everything's ready, just run:
yarn publish