How overages are managed
Advertised plans include the following monthly usage limits:
CDA API calls
The number of requests made to our Content Delivery API.
Developer plan: 100,000 calls
Professional plan: 1,000,000 calls
CMA API calls
The number of requests made to our Content Management API.
Developer plan: 10,000 calls
Professional plan: 100,000 calls
Bandwidth
The amount of asset data transferred between our Asset CDN and GraphQL Content Delivery API and content consumers.
Developer plan: 10GB
Professional plan: 1TB
Video streaming
The amount of streaming time produced by videos that are part of your project.
Developer plan: 2 hours
Professional plan: 150 hours
Please note that monthly limits are reset on the 1st of each month. Details about overage billing are found in the billing section.
Monitoring data usage in Dashboard
If you have multiple projects, or you want to check data usage without entering a specific project, you can do so from our Dashboard.
Overage status
Located in the "Plan and Billing" page, this panel serves as a health indicator for your data consumption, covering bandwidth (traffic) usage, API calls, and video streaming.
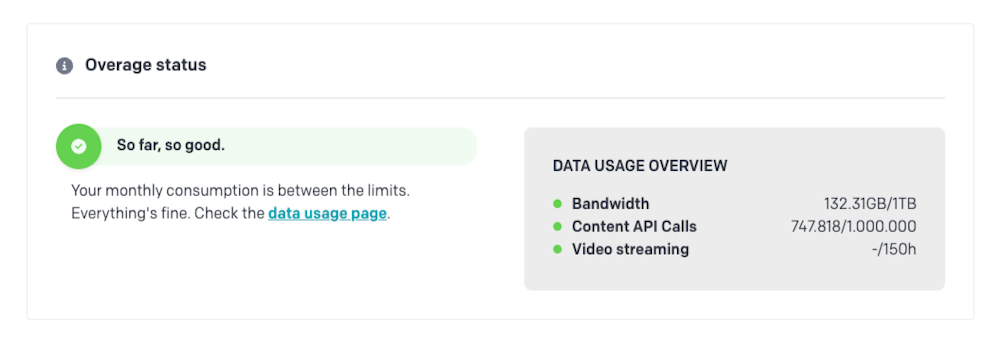
Here's what the different status colors mean:
🟢 So far, so good: You are within your plan's limits.
🟡 Your attention is needed: You are approaching your plan's limits and may face overage charges if exceeded.
🔴 Limits exceeded: You have surpassed your plan's limits, and additional usage will be billed.
If your plan is in a "yellow" or "red" state, we'll also give you a heads up by showing a notification badge next to the Plan and Billing link in the navigation.
For a detailed view, simply click on the "Overage Status" panel. This action will redirect you to the Data Usage page.
Data usage
This page provides detailed charts displaying your usage trends over time.
Here's what you can expect:
Usage Segmentation: View data by resource type, either aggregated or by individual project.
Time Comparison: Compare current usage with the previous month.
Historical Data: Access your data history to review long-term trends.
Forecasting: Get predictions of end-of-month usage to proactively manage your resources and prevent overages.
If you have the appropriate permissions, you'll find direct links to the Project Usage Page for a granular look at each project's consumption.
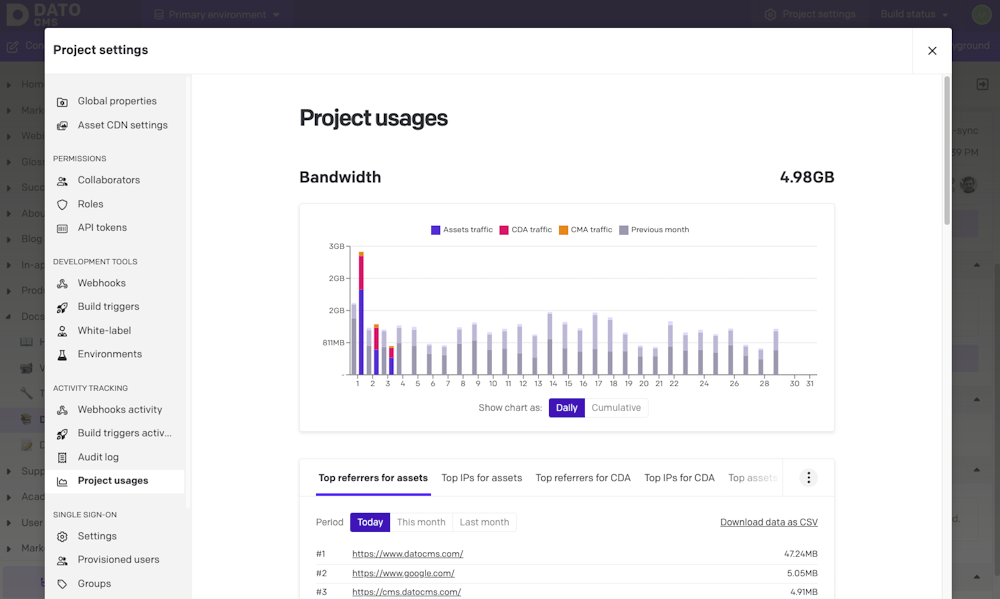
Monitoring project usage
It is possible to check the day-by-day consumption of a project from the "Project usages" section that is part of the "Project settings" area. This section presents various graphs and detailed tables for the current and previous month.
Exceeding your plan's limits
When you reach a usage limit on a free plan project, the service will be temporarily disabled until the beginning of the following calendar month.
For projects that are part of a paid plan, exceeding the limits does not lead to an interruption of service, but will result in an additional fee commensurate with the excess use.
The current overage rates are as follows:
CDA API calls: €9 per additional 1M operations
CMA API calls: €9 per additional 100k operations
Bandwidth: €29 per additional 150GB
Video streaming: €9 every 150 hours of extra video streaming time
Details about overage billing are found in the billing section.
Changing your plan increases or decreases the monthly limits of DatoCMS in real-time.
Progressive notifications
Our system helps you monitor resource usage and avoid unexpected interruptions or charges on paid plans.
You receive progressive notifications as you approach or exceed your limits. Free plans are blocked once the limit is reached, while paid plans can continue with additional charges. Notifications are sent at 50%, 80%, and 100% for free plans, and at 80%, 100%, and at the end of month for paid plans. You can always check your usage in the dashboard, and we aim to keep you informed without overwhelming you with alerts.
4K Video Streaming
If you upload a video with a resolution that exceeds 1080p. and have the "4K Video Streaming" feature enabled on your plan, the video player will be able to serve higher resolution streaming for your viewers (up to 4K/2160p).
Seconds of videos delivered in a resolution higher than 1080p will be charged with a 3x multiplier on DatoCMS due to the higher costs that Mux applies in this case. That is, if a visitor streams 30 seconds of a video in 4K, DatoCMS will count the view as 30s x 3 = 90s.
The video player selects the best video resolution based both on the density of the screen and the actual size of the player in the page, so you will only pay for the actual streaming time that occurred at resolutions over 1080p. In other words, displaying higher resolution videos on a small-sized player won't lead to extra streaming costs.
To cut down on your delivery expenses, you can stop providing streaming for a video above a certain resolution by using a max_resolution query parameter to the regular Playback URL. This modifies the resolution options available for the player to select from:
https://stream.mux.com/{PLAYBACK_ID}.m3u8?max_resolution=1080pThe max_resolution parameter can be set to 720p, 1080p, 1440p, or 2160p.
As of today, 4K video streaming is only available upon request on Enterprise plans. Therefore, for the vast majority of customers, we will not apply multiplier will ever be applied to the seconds of video streaming delivered.